
Metrics help when you understand how they are produced and mislead when you do not. This guide walks through the figures you meet when choosing an affordable indexed journal — impact factor, CiteScore, SJR, quartiles and the h5-index — using worked examples, and then shows how to balance them against fit and fees. To look more broadly at affordable journals with credible metrics, read how to find low-cost high-impact factor journals.
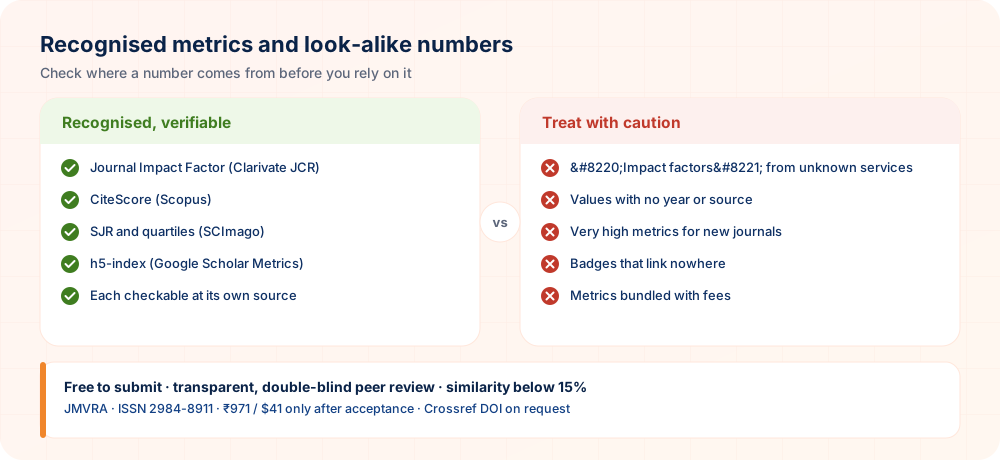
Four Metrics You Are Likely to Encounter
| Metric | Made by | Based on | Free to check? |
|---|---|---|---|
| Journal Impact Factor (JIF) | Clarivate | Web of Science, 2-year window | Listing is free; JCR values are usually reached through an institution |
| CiteScore | Elsevier | Scopus, 4-year window | Yes, on Scopus Sources |
| SJR | SCImago | Prestige-weighted, based on Scopus data | Yes, on scimagojr.com |
| h5-index | Google Scholar Metrics, 5 years | Yes, in Google Scholar Metrics |
Worked Calculations
Impact factor. Suppose a journal released 120 citable items in 2023 and 130 in 2024, which makes 250 in total. During 2025 those items drew 500 citations. Its 2025 impact factor therefore equals 500 ÷ 250 = 2.0.
CiteScore. That journal also issued 480 documents over 2022–2025, and those drew 1,920 citations across the four years. Its CiteScore works out as 1,920 ÷ 480 = 4.0.
The figures are different since the time windows, counted document types and databases are not the same, and neither one is “right”. For this reason, a JIF should never be set against a CiteScore, nor should either be compared with a number computed from Google Scholar data.
Understanding Quartiles Through an Example
Quartiles place journals in rank order inside a subject category. Where a category holds 100 journals ordered by some metric, positions 1–25 form Q1, 26–50 form Q2, 51–75 form Q3 and 76–100 form Q4. Keeping a note of the ranking source helps you repeat the comparison later.
| Rank in category | Quartile | What it tells you |
|---|---|---|
| 8 of 100 | Q1 | Counted among the most-cited in the category |
| 37 of 100 | Q2 | Above the median |
| 62 of 100 | Q3 | Below the median |
| 91 of 100 | Q4 | Counted among the least-cited in the category |
One journal may sit in Q1 for a category and Q2 for another, and JCR and SCImago quartiles may not agree. Make a habit of naming the source, category and year.
How to Read a SCImago Journal Profile
- Subject area and category — the field against which the journal is measured.
- SJR and quartile by year — study the trend over time rather than a single year.
- H-index — an h-index for the journal covering its entire history.
- Total documents and citations — extremely fast growth may signal a problem.
- Coverage years — the point at which Scopus coverage began and whether it is still ongoing.
Follow the publisher link on the profile to get to the real journal website rather than a cloned copy.
Transparent metrics and affordable publishing
JMVRA’s stated impact factor of 11.25 is calculated from Google Scholar data and is not a Clarivate JIF. The fees of ₹971 INR / $41 USD apply only after acceptance.
How to Verify Indexing and Metrics
| Claim | Verify at |
|---|---|
| Web of Science / JIF | Master Journal List and Journal Citation Reports |
| Scopus / CiteScore | Scopus Sources |
| SJR / quartile | SCImago Journal Rank |
| DOAJ | doaj.org |
| ISSN | ISSN Portal |
Using a Decision Matrix for Metrics, Fit and Fees
Rate every candidate journal from 1 to 5 on four factors, giving fit the greatest weight. Here is an example for an engineering paper:
| Factor (weight) | Journal A | Journal B | Journal C |
|---|---|---|---|
| Fit with the paper (×3) | 5 | 3 | 4 |
| Verified metric meeting your requirement (×2) | 2 | 5 | 3 |
| Affordability (×2) | 5 | 1 | 4 |
| Review transparency (×1) | 5 | 4 | 3 |
| Weighted total | 34 | 28 | 29 |
Journal A comes out ahead as the paper suits it best and it costs less, although B has the stronger metric. Should your institution require a specific database, use that as a first filter and score only the journals that meet it.
Myths About Metrics
- “If the impact factor is higher, my paper is sure to get more citations.” How often individual papers are cited can vary hugely even inside the same journal.
- “An impact factor is an impact factor.” Clarivate alone publishes the Journal Impact Factor, and other figures draw on different data.
- “Indexed means good.” Being indexed is a helpful indicator but no guarantee, since databases also drop journals.
- “Expensive journals have better metrics.” A good number of widely cited journals ask nothing from authors.
Where JMVRA Stands
The impact factor shown for JMVRA is 11.25. It is derived from Google Scholar data and is no Clarivate Journal Impact Factor. JMVRA appears in Google Scholar and registers Crossref DOIs when asked, yet it is absent from Scopus, Web of Science and DOAJ. Read JMVRA impact factor explained and indexing verification for details.
How to Look Up the h5-index
For the journals it covers, Google Scholar Metrics reports the h5-index, which is the largest number h for which h articles from the last five complete years each have at least h citations. To look up a journal, go to Google Scholar, pick Metrics and enter the journal’s name. The h5-index costs nothing and is broad, yet its coverage and method differ from JCR and Scopus, so only compare it with other h5 values. Note the date you checked, since figures can change when the data is refreshed.
Field-Normalised Metrics
Since fields cite at different rates, certain metrics make allowances for this. SJR gives more weight to citations that come from prestigious journals, while SNIP (Source Normalized Impact per Paper, listed with Scopus metrics) adjusts for the varying citation potential of different fields. When comparing journals in nearby disciplines, field-normalised metrics serve better than raw averages, although staying within one category remains the safest approach.
Warning Signs Hidden in a Journal’s Figures
| Pattern | Possible concern |
|---|---|
| Output of articles growing sharply each year | Quantity favoured above review |
| A metric that leaps up abruptly | Citation manipulation or effects of special issues |
| Excessive self-citation | Figures boosted by the journal’s own doing |
| A metric given with no year or source | Cannot be verified |
| Scopus coverage that has stopped | It is possible the journal was discontinued |
Worked Example Using Three Journal Profiles
Picture three journals that turn up when you search for your topic. Their public details could look as follows:
| Journal | What the profile reveals | Interpretation |
|---|---|---|
| Journal R | Covered by Scopus from 2012–present; SJR Q2 within its category; consistent output | A dependable, well-known journal; look at its fee and waiver policy |
| Journal S | Boasts an “impact factor 7.8” issued by an unknown service; its output tripled during the preceding year | The metric cannot be verified and the growth is odd — proceed with caution |
| Journal T | Indexed by Google Scholar; review is transparent; fee comes after acceptance; openly says it is not in Scopus | Candid and low in cost; a fit when Scopus is not needed |
Which one to choose hinges on your requirement. Where the rule insists on Scopus, Journal R is the only one that qualifies. Where it does not, Journal T could be both the better fit and better value, and Journal S needs verification before anything else. Write down your reasons so you can justify the final choice later.
How to Find Affordable Journals With Strong Metrics
- Within SCImago, go to your subject category and sort by SJR, then make a note of Q1–Q2 journals that carry your type of study.
- Look at the publisher’s fee page for every one, since many are subscription journals asking authors for nothing.
- Inside DOAJ, narrow your subject using “without fees” to locate diamond open access journals, and afterwards check their metrics.
- Before submitting to a journal with high fees, enquire about waivers, as the criteria differ between publishers.
- Leave a low-cost, transparent journal on your shortlist for papers with no database requirement.
Interpreting a Metric Requirement
If a rule mentions “journals with an impact factor” or “Q1/Q2 journals”, put three questions to yourself before deciding: which metric (JIF, CiteScore or SJR), which category (that of your discipline, or any), and which year (when you submit or when it is published). Note down what you find. Arguments over whether a paper “counts” usually stem from these three points, not from the paper.
Metrics Checklist
- Source namedWho produced the figure
- VerifiedConfirmed at that source
- Year notedMetrics shift every year
- Same fieldCompared inside the category
- Fit firstPaper matches the journal
- Fees knownBilled only after an acceptance decision
Interpreting Journal Metrics Without Being Misled by Them
Metrics can inform a choice of journal, but they are easily misread or overstated. Use these habits to keep numbers in perspective while you balance quality, relevance and cost.
- Always check the source. When a journal shows a metric, find out who calculated it and how, then look at the original provider if you can. Unattributed figures deserve caution, however impressive they appear.
- Compare within the same field. Citation habits differ greatly between disciplines, so a modest figure in one area may be strong in another. Compare journals only against others that cover similar subjects.
- Look beyond the headline figure. Read the aims, the editorial board and a sample of recent articles. A journal whose papers resemble yours and read well is often a better fit than the highest-scoring option.
- Record your decision criteria. Write down what matters to you, such as scope, review quality, openness and cost, before comparing. A written list stops a single flashy number from overriding your real priorities.
Treat metrics as one clue among many, verify where they come from, and choose by fit and quality.
Questions Researchers Often Ask
In Summary
A metric is a tool and never a final verdict. Learn who produced the number, confirm it where it originates, compare only inside your own field and year, and balance it with fit and fees. Using a sound decision matrix often points to a low-cost journal that matches the paper more closely than the top figure on offer. Related: low-cost journal publication and peer-reviewed journals after UGC-CARE.
Ready to send in your paper?
JMVRA accepts submissions online, free of charge. Papers undergo screening followed by transparent, double-blind peer review; ₹971 INR (Indian authors) or $41 USD (foreign authors) is payable solely after acceptance. Keep a copy of every confirmation email for your records.
References and Sources
Taking a Draft Through to a Published Paper
- PrepareStick to the template and author guidelines
- Submit onlineCosts nothing; write down your paper ID
- ScreeningSubject scope, declarations, and a similarity level beneath 15%
- Double-blind reviewDecision by email and WhatsApp
- Accepted₹971 INR / $41 USD is due, followed by open access publication
For details, see Publication guidelines · Peer review · Publication charges.
Ready to Publish? Submit to JMVRA
JMVRA is aligned with UGC's Suggested Parameters for Choosing Peer-Reviewed Journals.
JMVRA is a Transparent, Peer-Reviewed, Open Access Journal (Refereed Journal). Following the discontinuation of the UGC and UGC-CARE journal listing, and in alignment with the latest UGC-CARE recommendations and guidelines, JMVRA is aligned with UGC’s Suggested Parameters for Choosing Peer-Reviewed Journals.
Further reading on jmvra.org
Key Terms
Subjects and search phrases this article addresses.
Related Reading
Further guides about affordable, peer-reviewed publishing.
Keep Reading on the JMVRA Blog
This article sits on the JMVRA journal blog, where practical guidance covering publishing, indexing, metrics and research integrity is written to be verifiable, not promotional.